
As developers, we are aware of just how important having a debugger in your toolkit can be. Especially for bugs with inconsistent behavior, where adding a printf can actively hide the problem. For kernel development, AMD offers its own debugger, ROCgdb, which is quite usable from the terminal. Yet, having it integrated into our editor can be very convenient. Thus, we will show you in this article how to use ROCgdb in the popular editor VS Code. This involves the setup, the commands to leverage GPU-specific functionality of the debugger, and some advanced use cases.
Basic setup with VS Code
We will start by stating that this tutorial assumes you are running VS Code on Linux and that you have at least the C/C++ extension installed, with some optional setup stages also requiring the CMake Tools extension. Setup on Windows will have caveats, given the more limited support for it from ROCgdb (for more details read here).
To get a basic setup where an executable is launched within ROCgdb, you need to make a custom launch.json. If you don’t have such a configuration file, you can click on the link in the “Run and Debug” panel to create a launch.json file, and when prompted about what type of configuration you’d like, select “(gdb) Launch”, which would appear if you have the C/C++ extension.
Once you do select the option to create the JSON file, you will get an entry under the "configurations" array that looks similar to this:
{
    "version": "0.2.0",
    "configurations": [
        {
            "name": "(gdb) Launch",
            "type": "cppdbg",
            "request": "launch",
            "program": "enter program name, for example ${workspaceFolder}/a.out",
            "args": [],
            "stopAtEntry": false,
            "cwd": "${fileDirname}",
            "environment": [],
            "externalConsole": false,
            "MIMode": "gdb",
            "setupCommands": [
                {
                    "description": "Enable pretty-printing for gdb",
                    "text": "-enable-pretty-printing",
                    "ignoreFailures": true
                },
                {
                    "description": "Set Disassembly Flavor to Intel",
                    "text": "-gdb-set disassembly-flavor intel",
                    "ignoreFailures": true
                }
            ]
        }
    ]
}This default configuration will not be able to launch any program at all, though, because the "program" field needs to be changed. This leads to a powerful feature of VS Code config files — they allow the use of variables, a reference of which can be found here.
For instance, putting in "${fileDirname}/${fileBasenameNoExtension}" will execute a binary with the same base name as a source file currently open in VS Code. Thus, if you have opened the file /home/username/testproject/main.cpp, VS Code will run the binary /home/username/testproject/main. And, of course, you can also hard-code a path to an executable, if it is not expected to change. Depending on your project, different options will be suitable, and the field gives the flexibility!
After setting the path to the executable to be debugged, you need to specify the path to the debugger itself. If you are unsure where your instance of ROCgdb is installed, go to a terminal and run the whereis command. You should expect an output similar to this if ROCgdb is found in PATH:
$ whereis rocgdb
rocgdb: /opt/rocm/bin/rocgdbNow you can add the field "miDebuggerPath": "/opt/rocm/bin/rocgdb" to your launch.json configuration. And this setup is sufficient to debug a HIP program! Thus, a final config that will lead to a working minimal configuration of ROCgdb looks as follows:
{
    "name": "(gdb) Launch",
    "type": "cppdbg",
    "request": "launch",
    "program": "${fileDirname}/${fileBasenameNoExtension}",
    "args": [],
    "stopAtEntry": false,
    "cwd": "${fileDirname}",
    "environment": [],
    "externalConsole": false,
    "MIMode": "gdb",
    "miDebuggerPath": "/opt/rocm/bin/rocgdb",
    "setupCommands": [
        {
            "description": "Enable pretty-printing for gdb",
            "text": "-enable-pretty-printing",
            "ignoreFailures": true
        },
        {
            "description": "Set Disassembly Flavor to Intel",
            "text": "-gdb-set disassembly-flavor intel",
            "ignoreFailures": true
        }
    ]
}After saving launch.json, you should see a different view of the Debug panel of VS Code, where you can select a launch configuration! After you compile your program with -g, which adds debug symbols, you can click the button that will appear, but you can also press F5. Et voila!
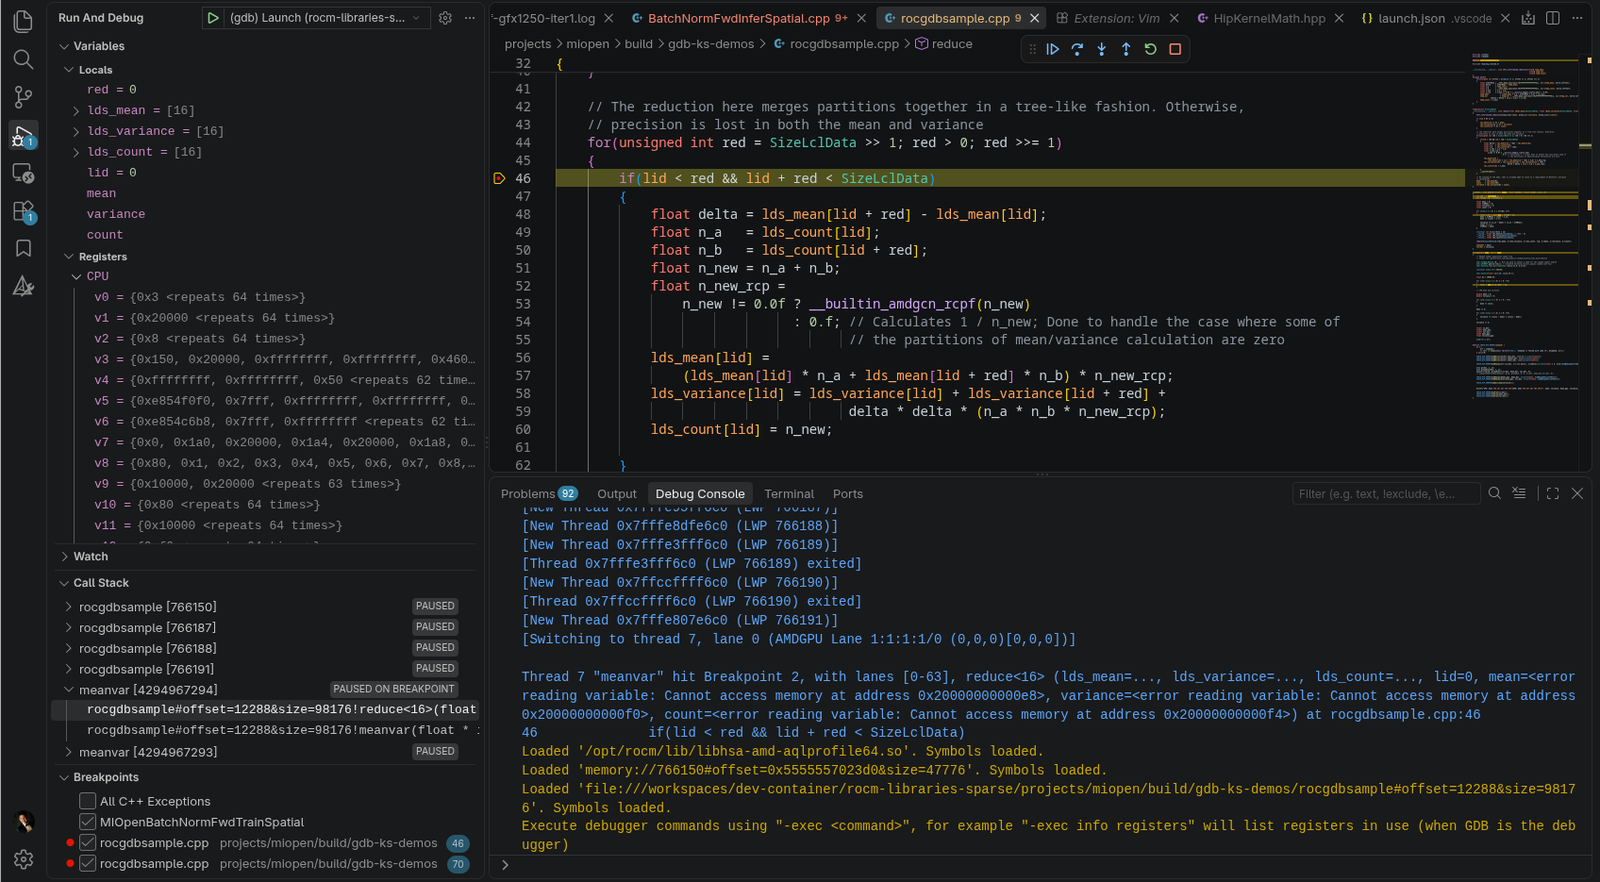
Demo of ROCgdb debugging a sample program, with a view of the local variables and registers.
Setup with CMake Tools
If you have a CMake project and you use the extension CMake Tools, then there are multiple options to configure the debugger.
The first option is to directly specify the debugger path and launch debug sessions via the CMake panel. For that, you need a settings.json file (which will again be in the .vscode directory at the root of the open folder, or alternative location depending on whether you are using a Dev Container or global settings). If no such config file exists, the following listing would provide the configuration necessary to set ROCgdb as the debugger:
{
  "settings": {
          "cmake.debugConfig": {
                      "miDebuggerPath": "/opt/rocm/bin/rocgdb"
          },
  }
}After creating or amending your settings.json to contain the CMake plugin’s debug configuration, you can select your target in the CMake Tools plugin’s panel, and just run the specified target!
The second option is to use a variable that the plugin exposes in the previously created launch.json. For the "program"field, you can set "${command:cmake.launchTargetPath}", which will work with the selected launch target. For more details on that, we invite you to read the documentation of the plugin itself, which can be found here.
Basic Usage
The way ROCgdb exposes the GPU’s threads for debugging is by presenting separate wavefronts as threads, and having commands to inspect the per-lane execution. And VS Code does recognize this, and can handle putting breakpoints in GPU code, highlighting it, etc. Yet, when reading values, this won’t work as expected. Especially when inspecting something like local memory or register values.
If you open the registers view, you will notice that the vector registers are presented as 64- (or 32-sized) arrays, and likely it will be presented as a single block of text. Furthermore, when you try to inspect a local memory address, you will not be presented with anything. Finally, when stepping in a thread, you will be in lane 0 of the wavefront that breaks.
The way to circumvent this is to pass commands manually to ROCgdb via the debug console. To that end, you need to open the tab on the lower pane, and select “Debug console“, after which you can specify ROCgdb commands directly by starting with “-exec”. This allows you to expose the extra functionality enabled by ROCgdb!
For instance, you can do -exec lane apply 17 print $v0, and that will print the value of register v0 for lane 17. Another example: in an execution where thread IDs from 7 to 22 are the wavefronts of a GPU kernel, doing -exec thread apply 7-22 -- advance 46 will advance the execution of all GPU wavefronts to line 46!
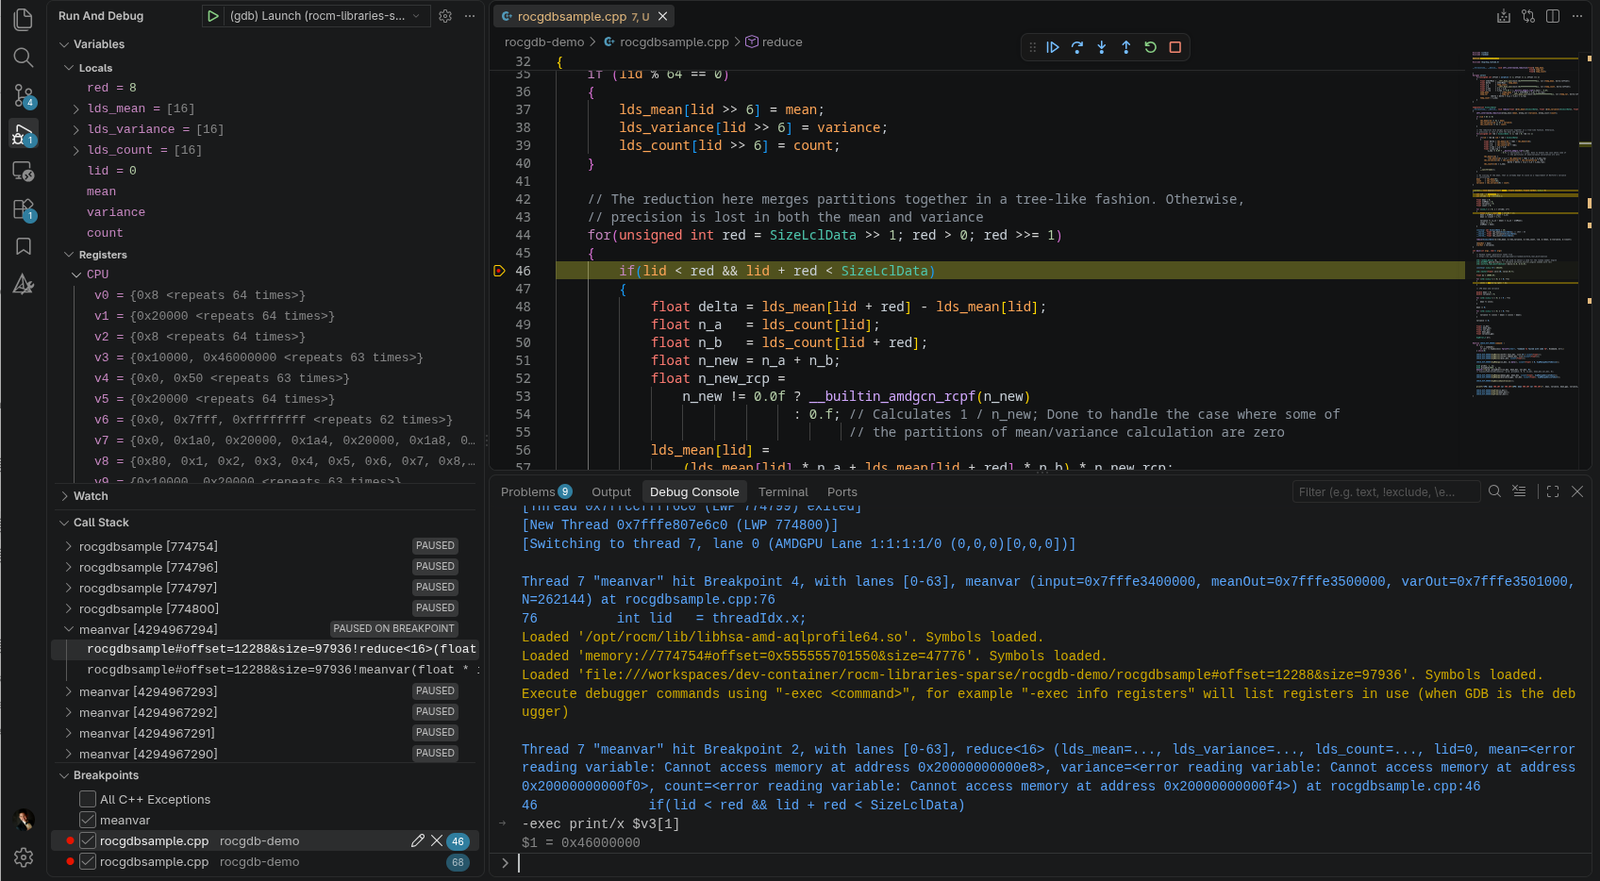
Printing the contents of a single lane of a register. Notice the Run And Debug panel not displaying the vector registers as arrays, but only as a block of text.
And finally, to inspect local memory, you need to again manually specify ROCgdb commands. For the case of examining memory, it is done via the x command. You will need to obtain the memory address of the array you want to inspect by looking at the address in the Debug panel, and then running -exec x <pointer> in the Debug console. An example is seen below, where we ran -exec x/10fw local#0x40 — printing 10 floating-point (f) 32-bit words (w) starting from memory address local#0x40
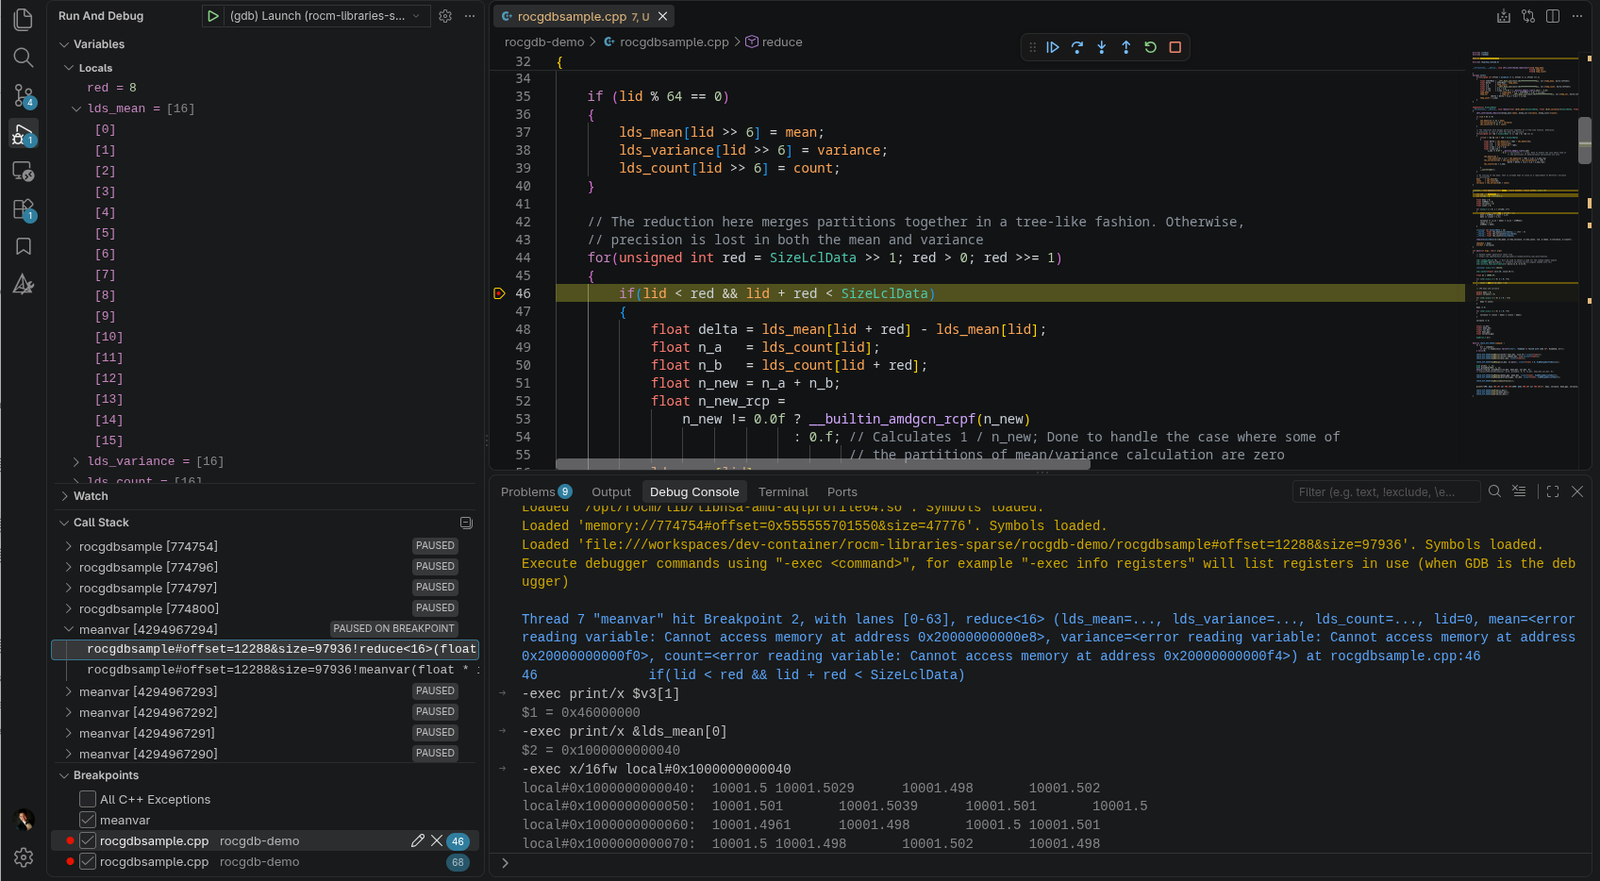
Printing the value of a local memory array with the x command of ROCgdb on an address in local memory. Having the left pane not display the values can happen if, for instance, local memory is passed by reference to an inline function.
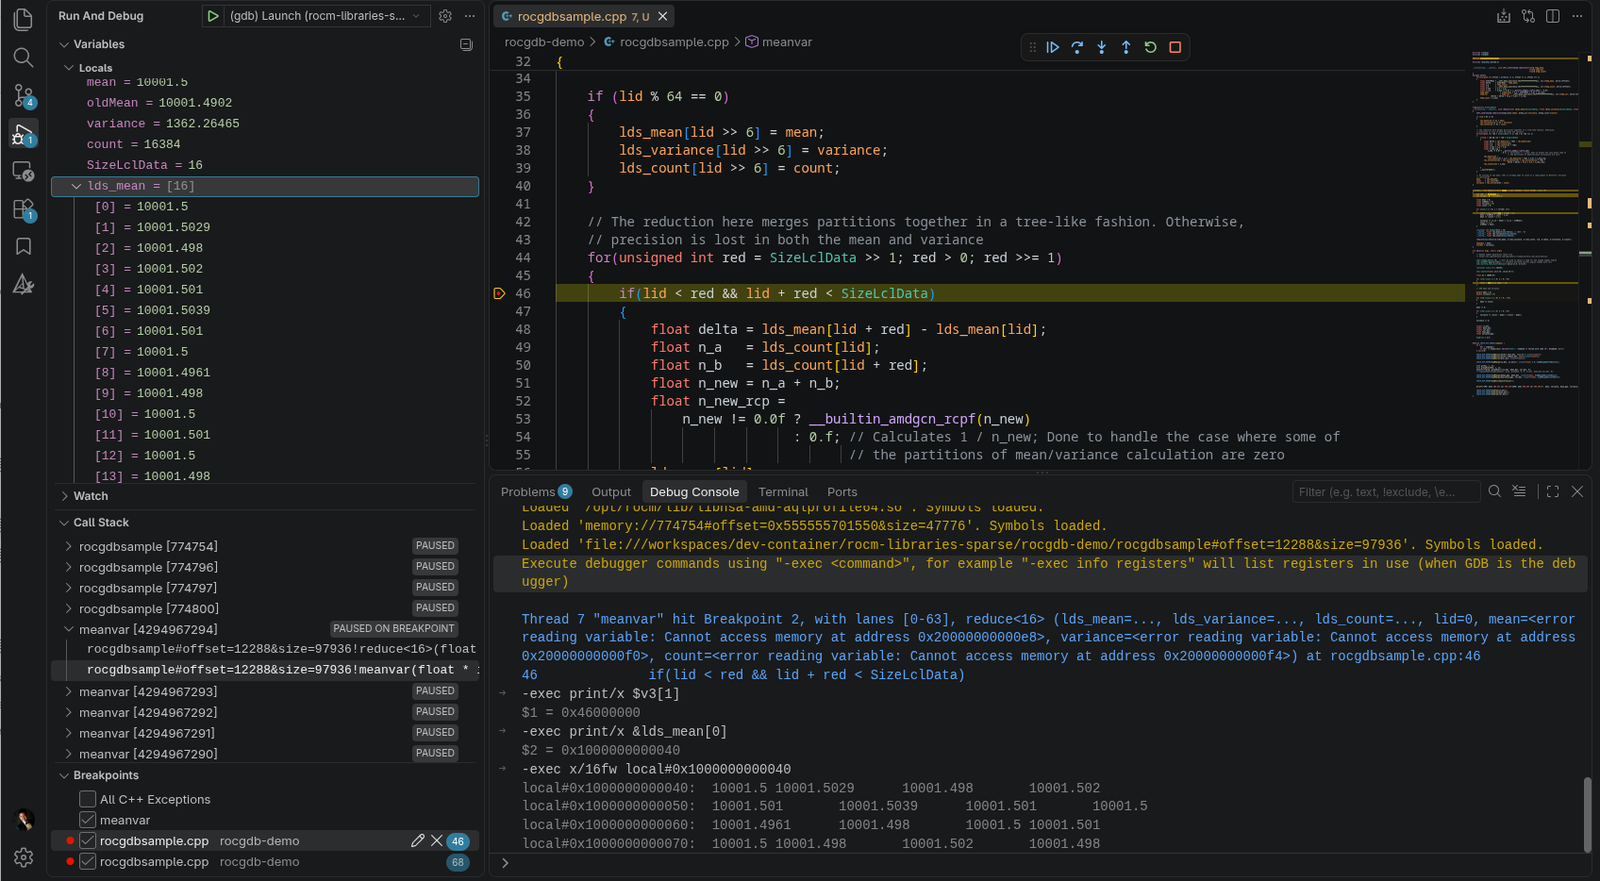
The same example as earlier, but viewing one stack frame earlier — the place where the kernel declares the local memory. Compare how in the earlier screenshot the lds_mean array does not contain any values.
Other than the extra steps needed to inspect per-lane execution, this setup works as a normal debugger, with highlighting of the currently executed steps and variables. There is, of course, far more to learn for ROCgdb, so for that, we invite you to read the following page of ROCgdb’s documentation here.
Advanced launch configurations
While the configuration we initially gave already provides a debugging environment, it does not cover some intricate use cases, namely when some sort of user input needs to be provided or when you have a runtime-compiled kernel.
Specifying Arguments
The good thing about this JSON file is that you can specify a set of arguments to launch the program with. You do so by adding strings in the "args" array as follows:
"args": ["arg1", "arg2"]Note that you have to separate each argument in strings:
// launches with 3 arguments (equivalent to ./test "arg1 arg2 arg3")
"args": ["arg1", "arg2", "arg3"]
// launches with 1 argument (equivalent to ./test arg1\ arg2\ arg3)
"args": ["arg1 arg2 arg3"]This is the drawback of this config file — if you have long arguments lists, you will run into the need to split up every argument into its own string.
Specifying environment variables
In launch.json, you also have the field named "environment", which is used to specify environment variables at the launch of ROCgdb. The way you do so is via an array of objects as such:
"environment": [
      {
          "name": "AMD_COMGR_SAVE_TEMPS",
          "value": "1"
      }
],User Inputs
When working on programs, you can run into situations where you need to manually specify some value before launch. While you can edit launch.json every time you need to, there is a convenient feature in VS Code — you can define your own input variables! They follow the syntax "${input:variableName}", and the definitions are found under the "inputs" field of launch.json:
{
// Use IntelliSense to learn about possible attributes.
// Hover to view descriptions of existing attributes.
// For more information, visit: https://go.microsoft.com/fwlink/?linkid=830387
"version": "0.2.0",
"configurations": [
{
"name": "(gdb) Launch",
"type": "cppdbg",
"request": "launch",
"program": "${fileDirname}/${fileBasenameNoExtension}",
"args": ["${input:input1}", "${input:input2}"],
"stopAtEntry": false,
"cwd": "${fileDirname}",
"environment": [],
"externalConsole": false,
"MIMode": "gdb",
"miDebuggerPath": "/opt/rocm/bin/rocgdb",
"setupCommands": [
{
"description": "Enable pretty-printing for gdb",
"text": "-enable-pretty-printing",
"ignoreFailures": true
},
{
"description": "Set Disassembly Flavor to Intel",
"text": "-gdb-set disassembly-flavor intel",
"ignoreFailures": true
}
]
},
],
"inputs":[
{
"id": "input1",
"type": "promptString",
"description": "Provide one argument",
"default": "",
"password": false
},
{
"id": "input2",
"type": "pickString",
"default": "debug",
"description": "Select a value",
"options": [
"val1",
"val2",
"val3"
]
},
]
}Of course, this is only a small example of how to use set them up. The variable reference of VS Code, linked earlier in this article, contains more details on how to utilize such, and also shows an example of them being used.
Runtime-compiled Kernels
If you normally run a program that uses HIPRTC, the HIP runtime compiler, you will not be able to step into the code you’re working with in VS Code. To that end, you need to take a few extra steps.
First, ensure that you pass the -g parameter to HIPRTC when compiling your kernel. Otherwise, you will not have any debug symbols in your GPU binary. This will preserve debug information, but due to the way kernels are built at runtime, you will not have access to the source code.
To do that, you need to add the following variable in our environment in launch.json:
"environment": [
      {
          "name": "AMD_COMGR_SAVE_TEMPS",
          "value": "1"
      }
],To break into the kernel, you need to manually specify a breakpoint in the Debug panel of VS Code, in the Breakpoints pane of the Run And Debug panel:
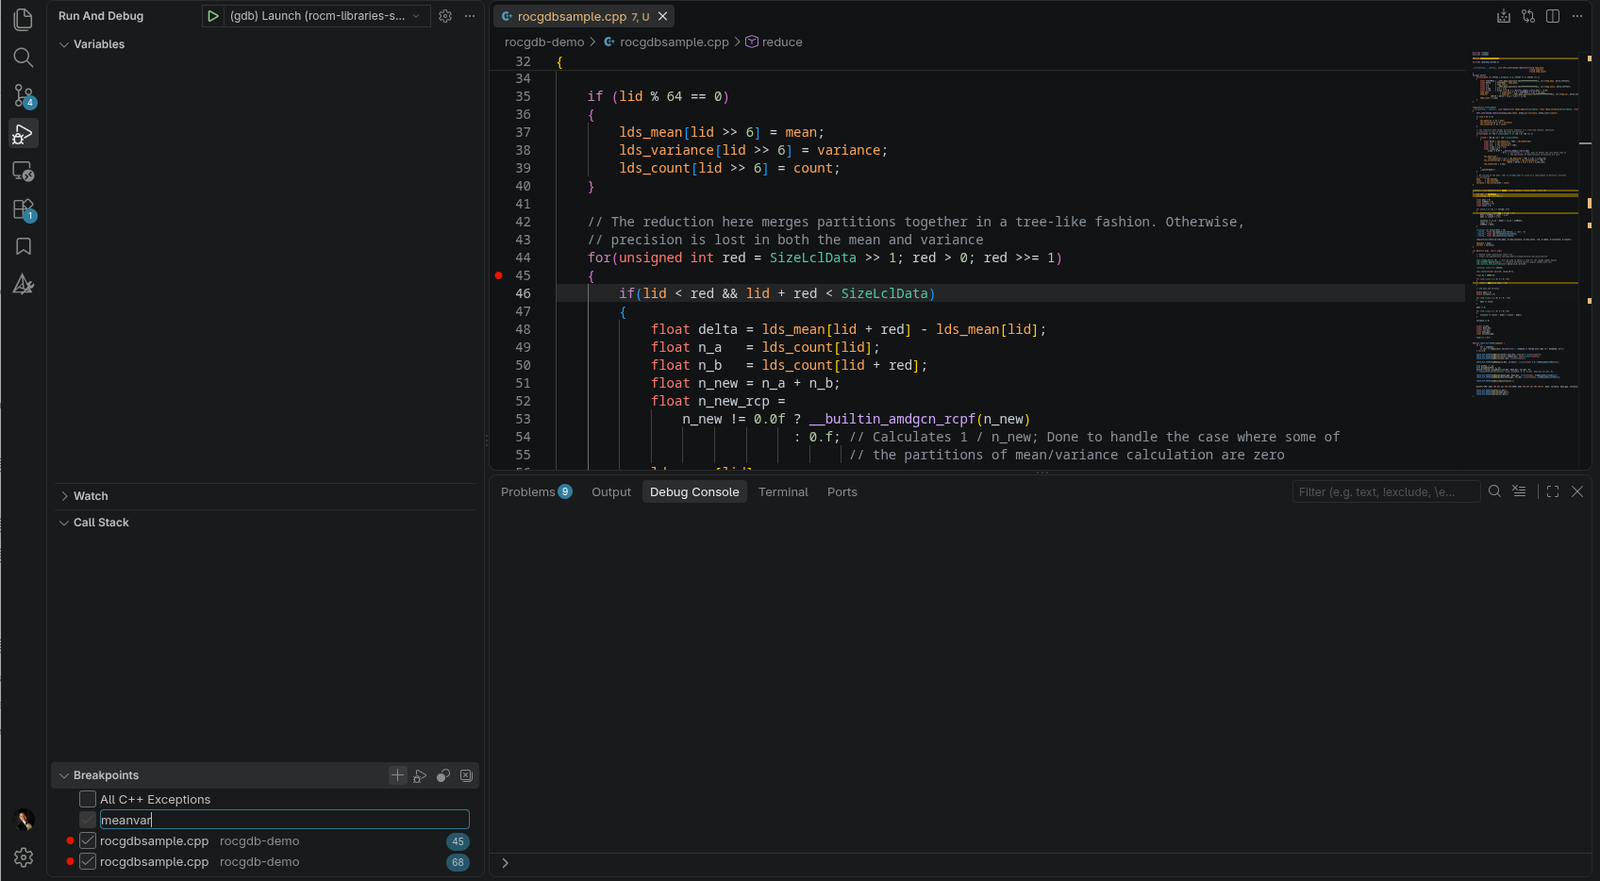
Adding a breakpoint manually. When specified from here, it takes the name of a function.
Only after taking these steps, will you be greeted by a source file in /tmp/comgr-*/input, with a kernel waiting for you to debug.
Conclusion
In this article, we showed you how to create a basic ROCgdb launch configuration for VS Code. We further demonstrated how to leverage the full functionality of debugging GPU code by specifying ROCgdb commands with -exec via VS Code’s Debug Console tab. Finally, we showed more advanced cases like runtime-compiled kernels and user inputs for parameters of launch.json. Having this setup in your arsenal will help you debug GPU code more easily. Yet, never forget the power of a rubber duck.