The printf-funtion in kernels isn’t the solution to everything, so hence profilers and debuggers specially tailored for GPU-programming. On Windows there is a lot of choice, but mostly only if you have a paid version of Visual Studio. On Linux you have GDB, but that program is not really user-friendly for the GUI-lovers.
For AMD there is now gDEBugger again available for Linux. Again, as version 5.8 by Gremedy worked with Linux, after AMD bought the company it got Windows-only for version 6. A few weeks ago, 10 months after 6.0, Linux-binaries got back with version 6.2. It supports OpenCL 1.2, OpenGL 3.2 and quite some extensions. As only AMD is supported, later more on debugging OpenCL-applications on NVidia and Intel.
Installation is quite straightforward. For creating a menu-item, you’ll find an useful image in /opt/gDEBugger6.2.xxx/tutorial/images/.
Turning on the driver’s debug mode
You need the latest drivers, or at least the 2.4.1 drivers for full support. And make sure the latest AMD APP, or at least 2.6 is installed and tested (by running ‘make’ in /opt/AMDAPP). Recently AMD has renaming a various libraries from “ati” to “amd” – if you get segmentation faults when using OpenCL, check if there are still ati-libraries loaded (in /etc/ld.so.conf.d for instance) and make sure there were no errors when installing the drivers. The new type xorg.conf is quite empty, as much happens automatically. AMD uses the old xorg.conf for settings, so make sure you have run
aticonfig –initial aticonfig –sb off
Else you get the following error:

To turn on debugging manually, in xorg.conf put the following at the [device]-section:
Option “BlockSignalsOnLock” “off”
Then reboot, and test by starting gDEBugger.
Your first gDEBugged program
Note: if you use Chromium/Chrome, the help doesn’t work. You must open them in Firefox. The tutorial helps mostly with things like keyboard-shortcuts and introducing the two OpenCL debug-levels: API-level and kernel-level. The webhelp goes into further detail, but you really should have read the tutorial (or this blog-post) first before starting there.
Preparing the software
Both the software and the kernel(s) need to be compiled in debug-mode. When you use GCC or LLVM-Clang you can use “-g” as one of the parameters to put the host-code in debug-mode. To get the kernel in debug-mode, you have to search for the build-step clBuildProgram and add the “-g” build-option:
err = clBuildProgram(program, 1, devices, “-g” , NULL, NULL);
This way the kernels will also be put in debug-mode. Best is that you write your host-code such that you can pass paramters to the kernel from the command-line. Don’t forget to use make in parallel using parameter ‘-j’, i.e.: “make -j 8″. I used “make dbg=1 -j 12″ to build the debug-version of NVidia’s SDK.
A new project
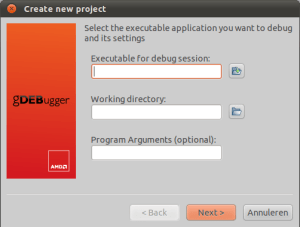
Starting a New Project goes via a wizard. Selecting the executable in the first screen is most times enough.

We won’t focus on OpenGL or Host-debugging, so leave the OpenGL-screens to default. You can always change the debug-settings under men debug.
Enabling breakpoints in Kernels
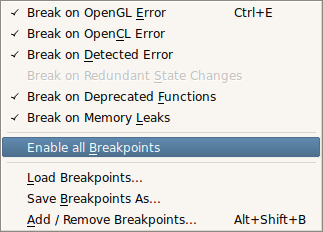
The menu breakpoints shows where it can break the process. The breakpoint-options are quite interesting though, as they help you identify problems you really don’t want.
It does not show a list of kernels unfortunately.

The written method is to keep stepping over the API-calls and then step into the kernel (described later). You can also manually add the kernel. To do that, go to the breakpoints view. If it is not visible, check the menu view->views.

There double click and write the name of the kernel. The type “cl kernel” will appear.

Know that stepping into won’t work when you have break points of type “cl kernel”.
Play
Now hit F5 or the green play-button.
![]()
Personally I don’t really see what the five buttons after the start-debug button do. There are two modes, while in host-code:
- Go to next frame-terminator call
- Go to next OpenGL draw-function call (OpenGL)
- Go to next API function call (being one of OpenCL or OpenGL)
- Step into (like normal debugging). If the current function enqueues a kernel for execution, then step into the kernel – only works when you have no breakpoint on a kernel.
- Step out (like normal debugging).
- Undefined
- Undefined
- Go to the next line.
- Step into (like normal debugging).
- Step out (like normal debugging).
It is somewhat confusing, but I ended up clicking the third button the most.
If all goes well, you end up in the kernel. There you can double click at the left side to get manual break points, step through, etc.

While at any break point…
The below is only visible, when the program runs – even the statistics. If any view is not visible, go to the menu view->views and select it.
To see the variables per instance, you need to find two views. At the top right you can select the kernel-ID.
![]()
At the bottom-left you’ll find the local variables for that instance.

Another view worth going through are the statistics.

The above warning is a possible problem, not necessarily true.
Happy debugging
There are a lot more functions in the program, which help you avoid using printf. Just fiddle around with the provided teapot-example to learn.

Nice post on gDEBugger! It saved me as apparently this is the only debugger for linux.
Are there really no nVidia tools for linux?